Technical Market Analysis
Die neutrale Begleitung für Finanzanlagen
Nicholas Daxelhoffer, CMT Chartered Market Technician, erläutert in seinem Beitrag die Grundlagen der technischen Marktanalyse, deren Einsatzmöglichkeiten und seine persönlichen Erfahrungen im Umgang mit diesem wichtigen Werkzeug für Investoren. Seine Ausführungen illustriert er anhand einer konkreten Fragestellung zur technischen Ausgangslage für den globalen Aktienindex MSCI World.
Wir freuen uns, dass N. Daxelhoffer in kommenden Beiträgen unter der Rubrik der TECHNIKER seine Beobachtungen zum Geschehen an den Finanzmärkten oder einzelnen Finanzanlagen mit den Lesern der Weissenstein News teilen wird. Anleger, die gerne mehr erfahren möchten, können sich direkt an den Autor wenden: ndaxelhoffer@bloomberg.net
DER TECHNIKER
kann auf eine Karriere von 30 Jahren in der Vermögensverwaltung für bedeutende institutionelle Kunden zurückblicken. Als studierter Oekonom musste er früh in seiner beruflichen Karriere erkennen, dass die fundamentalen Faktoren ganz massiv durch die Manipulation der Märkte geschwächt werden. Regierungen, Zentralbanken, aber auch mit Hilfe der Medien, werden die Marktkräfte ausgehebelt und schwächen damit den Nutzen der fundamentalen Analyse vor allem im makroökonomischen Bereich. Vor diesem Hintergrund wird es verständlich, dass der TECHNIKER unter den herrschenden Bedingungen letztlich nur noch den Preisen und dem Preisverhalten einigermassen traut.
Die technische Marktanalyse kann eben so wenig wie die fundamentale Analyse „in die Zukunft blicken“. Was diese Methode der Finanzanalyse jedoch in objektiver Weise ermöglicht, ist die Bestimmung des IST Zustandes. Ausgehend von der Tatsache, dass Entwicklungen eine gewisse Stabilität aufweisen, kann das über Jahre geschulte Auge eines erfahrenen Markttechnikers das Verhalten der Preise vor allem aber auch auftretende Veränderungen im Angebots- und Nachfrageverhalten der Marktteilnehmer in der Regel zeitgerecht und nutzbringend erkennen.
Aus der Reaktion der Märkte auf Neuigkeiten kann in der Regel einiges an Information gewonnen werden. Im Gegensatz zur fundamentalen Analyse beinhaltet die technischen Analyse immer auch eine Risikokontrolle, denn entwickelt sich eine Anlage entgegen der Positionierung, so ist diese in der Regel abzustossen. Ferner tritt die persönliche Meinung und Präferenz des technischen Analysten im Vergleich zur Sichtweise durch den Markt in den Hintergrund. Es ist eine altbekannte Tatsache, dass der Markt immer recht hat, bzw. die Marktpreise sich im Portfolio des Anlegers zeitgleich spiegeln und somit über seinen Erfolg und Misserfolg bestimmen.
Naturgemäss ist der TECHNIKER dem Momentum verpflichtet, was es ihm erlaubt - zusammen mit dem Risikomanagement - auch Positionen (Spekulationen) in fundamental sehr schwierig greifbaren Situationen, die oftmals grosses Zukunftspotential haben, zu tätigen. Viele der heute bekannten und sehr erfolgreichen Gesellschaften im Technologiebereich entzogen sich zum Zeitpunkt der Publikumsöffnung einer fundamentalen Bewertung, denn die Gewinne hingen von weitgehend unbekannten Entwicklungen von deren Produkten und Märkten in der Zukunft ab. Alle wiesen jedoch früher oder später eine grosse Gemeinsamkeit auf: Ein Preismomentum, das weit über dem Markt lag und manche dieser Aktien in ungeahnte Höhen trug. Die technische Analyse ist am besten geeignet diesen Sachverhalt zu entdecken und ein Engagement des Anlegers zu begleiten. Darüber hinaus kann diese hilfreich sein, wenn es darum geht Vermögensklassen zu „timen“ und stiftet damit grossen Nutzen bei der Kapitalallokation.
Der TECHNIKER dieses Blogs ist solidem Handwerk verpflichtet, wie es der Erfahrungsschatz der technischen Analyse lehrt. Allzu komplizierten und guruhaften Methoden kann er wenig abgewinnen und ist der Meinung, dass jeder technische Indikator letztlich nichts anderes ist, als die Preisdarstellung nach dem durchlaufen einer Formel und somit keine wirklich neue Information enthält. Auch beteiligt er sich nicht an der Suche nach den «vorlaufenden» Indikatoren zum Preis, denn der Preis beinhaltet alle verfügbaren Informationen in Realzeit. Stimmungsindikatoren und Informationen zur Positionierung der Marktteilnehmer könnten von Wert sein, das Problem jedoch ist deren Unvollständigkeit in einer globalisierten Welt. Am Ende bleibt dem TECHNIKER nichts anders üblich, als seine langjährige analytische Erfahrung auf die Preisstrukturen zu applizieren und sieht das Verbesserungspotential vorzugsweise in der Disziplin der Anleger und dem Beherzigen von altbekannten Börsenweisheiten, wie zum Beispiel «The Trend is your friend».
CREATING MY REALITY AS A TECHNICAL MARKET ANALYST
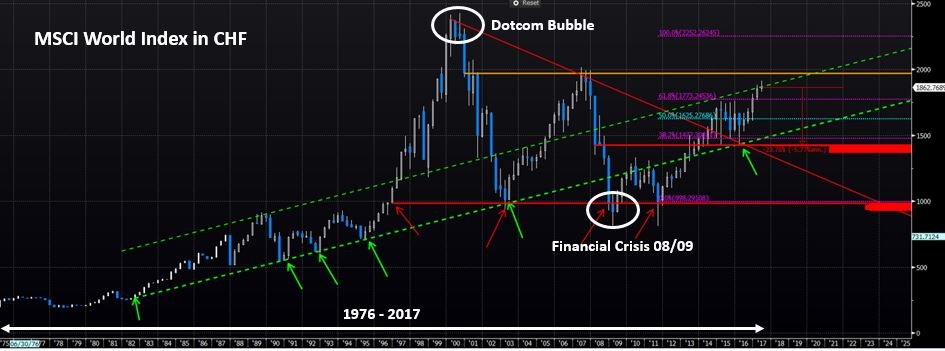
People can make their own reality when it comes to markets. Currently there is a strong consensus that the Bull market is in a sort of «bubble» and has become very old in terms of duration. Let’s have a look at the current chart of the World Index that covers developed markets and is shown here in Swiss Franc (Reference Currency):
There are several problems with that particular view as a lot depends on the timeframe you’r looking at and the currency perspective:
1. I like to start with a truly long-term timeframe and get down to shorter-term timeframes later. Without a «big picture», we tend to become too short sighted for long term investing. The current chart of the MSCI World (CHF) is characterized by a long term uptrend that shows two distinctive mountain tops (2000, 2007) that were followed by severe market declines (-60%, -50%). From 2000 on a typical Swiss investors have suffered annual losses of about 6% during 11 years! A third mountaintop, that could have led to another significant decline of 40% to the support level at 1000 did not materialize as prices have reversed in late 2017. Prices are currently travelling still within the long-term uptrend range that started in 1982, but seem to be on the verge of breaking out (more on that later).
2. The ascent of the trend is heavily dependent on the currency view that is applied. As shown in the chart, the trend rate is about 5% p.a. and as a rule of thumb, one can add 2% for views in Dollar and EUR on long term time frames (add 4% for British Pound!). These numbers show, that for global market analysis and comparison, it is crucial how you compare. For long term comparisons, I look at markets valued in my reference currency because it shows me "what I really get". But my approach is frequently challenged especially by people who like to separate the decision between the "market" and the "currency". Purists tell me, that you can invest and hedge the currency risk and that it contains two separate decisions. Frankly, I can't share this view for several reasons: First of all, you could destroy a lot of value when you are wrong on both sides. Just imagine that you "think" the US market will go up but the USD will go down. What happens to your performance if the opposite outcome happens? Another point I make - as a technician and a momentum player - the markets and my investments in particular should have enough momentum to compensate for a weak currency. Otherwise the price momentum is not really strong enough and I tend to shun low momentum situations. Finally, costs: In the long run, transaction costs of hedging and adjusting hedges become a drag on performance especially for small to midsize portfolios.
Based on my view the market is NOT in a “bubble”, but the duration of the Bull market could be judged as “long” and “overdue” for a Bear market. But once again it depends on the view because from the high set in 2016 to the low reached in 2016 the market fell by about 20%, which is usually associated with a Bear market behavior. The low set in 2016 was remarkable as it matched the long term up-trend, the down-trend from 2000 and an important “inflexion point” dating back to 2008! IF but only IF we apply that particular view we could expect the market to continue its ascent and likely reach 2250 sometime down the road. Based on my experience and technical rules, I come up with this price target based on the length of the first leg from 2011 on and the absence of a topping process so far.
As with all prognostication, we should pay a lot of attention in case our expectations are not matched. I consider the risk management aspect of Technical Analysis at least as important as the forecasting ability. We therefore need to discuss other potential outcomes that would signify "risk": The market is currently at the upper boundary of the trend channel and could encounter resistance like in 1989. Even if the market is able to penetrate out of the channel territory, it will most likely encounter resistance at 2000. Another outcome could be a significant reversal that would nullify my expectation. In this case, I expect the index to find a first support at 1640 followed by 1490. Reaching towards 1430 would set off alarm bells, crossing that level would entice me to hedge my portfolio and in case we fall below 1000, I probably need to quit my profession as we would fall back into the middle age. For the time being, I expect the Bull market to continue, but in case I am proven wrong by the market, I have a plan and so should you!
Nicholas Daxelhoffer

Comment